Calendar Year 2024 Climatological Summary
Temperature

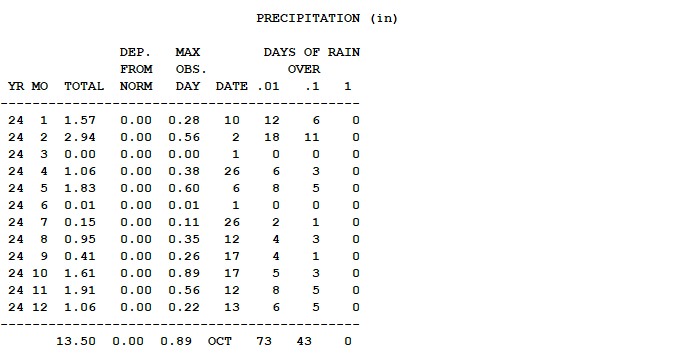
Precipitation
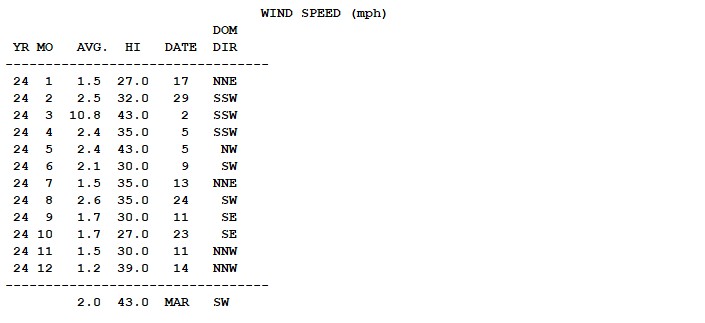
Wind
Summer was hot with 67 days of 90 F (32.2 C) or higher. The coldest day was January 16 with a temperature of 10 F(-12.2 C). The coldest days of the year are usually between December 20 and January 15. The hottest day was 103.0 F (39.4 C) on July 11. The average temperature for the year was 55.0 F (12.7 C).
The total precipitation was only 13.50" ( cm) The wettest months were February, May and October. June through September had little precipitation. June is generally wetter than 0.01" ( cm). Early June is well known as a wet period.
Wind direction is generally from the southerwest, and it was again this year. The maximum wind speed was 45 mph recorded on March 2 and May 5th. The average wind speed for the year was 5.0 mph.As is common MArch was by far the windiest month of the year.
December 2024 Climatological Summary

Temperatures were well above normal (34.0 F) (1.1 C), while precipitation was below normal at 1.06" (2.7 cm) versus the 27-year average of 1.84" (4.7 cm).
The year 2024 started with solid precipitation totals in January and February. We'll need something similar in 2025 (during January-May) to avoid falling back into a draught situation when next Summer arrives. The last three months of 2024 (especially October) were good but not great.
The 27-year mean temperature for December is 29.9 F (-1.2 C). This month's 34.0 F (1.1 C) is well above that. December started off very dry. There was no significant precipitation until Christmas Day. Five more days of rainfall/snowfall followed as a storm off the coast of California sent waves of moisture eastward. The dominant airflow from the south prevented much valley snowfall. What did fall was soon melted (except for areas with little direct sunshine.)
November 2024 Climatological Summary
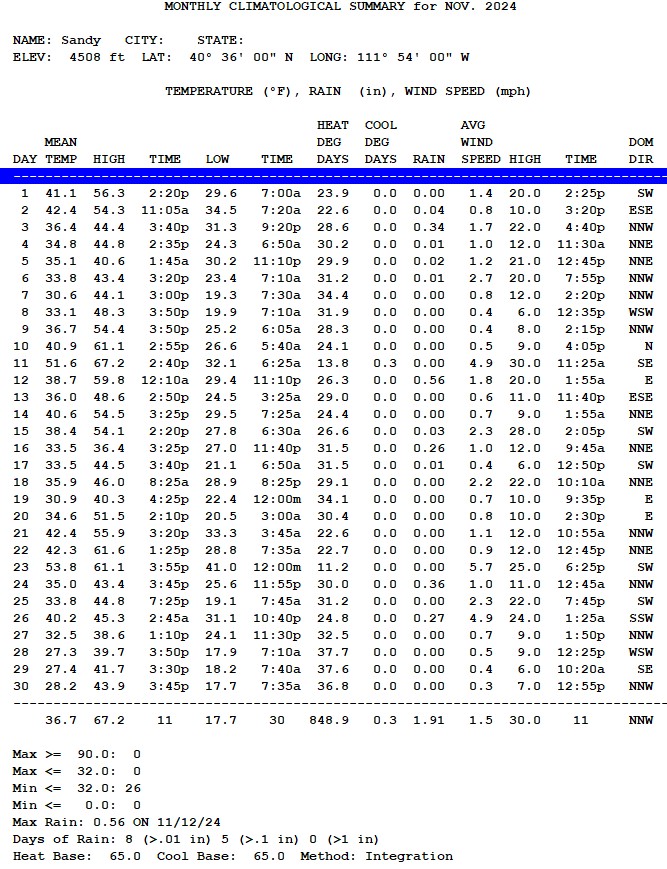
Precipitation continued the trend that started in October with more than-average precipitation. The November 2024 total was (1.91") (4.8 cm) well above the 27-year average of 1.57" (4.0 cm). This trend will help keep us from falling back into a draught situation.
Temperatures were colder than usual. The monthly mean temperature was 36.7 F (2.6 C), 2.9 F (1.6 C) degrees below normal. Snow was not uncommon at times, mainly during the second half of the month. It mostly disappeared quickly in the valley, except in well-shaded areas.
Now, don't get all Trumpy here, but one month of lower-than-average temperature does not disprove the concept of global warming. When examining long-term trends, you never look at one day, one month, or even one year's data. The most extreme temperatures over the 27 years are High (74.4 F) ( C) (2016) and low 6.0 F ( C) (2011). Regarding precipitation, the maximum is 3.74" (9.5 cm) (2001), and the minimum is 0.25" (0.5 cm) (2009).
October 2024 Climatological Summary
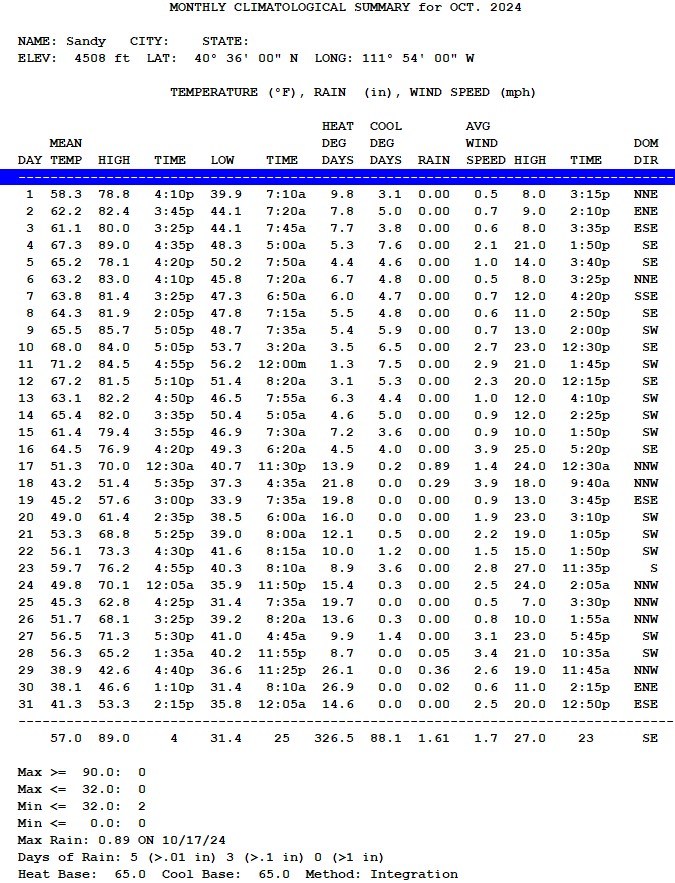
Finally, the monthly rainfall climbed to above average. October 2024 saw 1.61" (4.1 cm), which is above the 27-year average of 1.42" (3.6 cm). We've developed a significant precipitation deficit from April onward, with May and October being slightly above average. You can see the data below. January 1.57" < 2.64" February 2.95" > 1.63" March 3.39" > 2.04" [Wettest in 27 years] April 1.08" < 2.44" May 1.87" > 1.83" June 0.01" < 0.98" July 0.16" < 0.52" August 0.95" < 0.97" Sept 0.41" < 1.15" Oct 1.61" > 1.43"
Let's hope we have a wetter-than-normal winter; otherwise, we will return to a draught situation.
The high temperature in October was 89 F (31.6 C), and the low temperature was 31.4 F (-0.3 C). The average temperature was 57.0 F ( C), far above the 27-year mean of 52.1 F ( C).
The data is irrefutable: Global warming is happening. Warmer temperatures allow the atmosphere to hold more moisture, which causes more flooding events. A part of Spair recently experienced a full year of rainfall in a single day, causing massive damage. It deserves the attention of all nations, and as with everything of significance, the United States should be the world leader in the fight.
I used to mow my lawn for the last time during the October General Conference weekend. That event has been the weekend before Halloween in the previous few years. I think I may do it one last time on November 2, a new late fall record.
September 2024 Climatological Summary
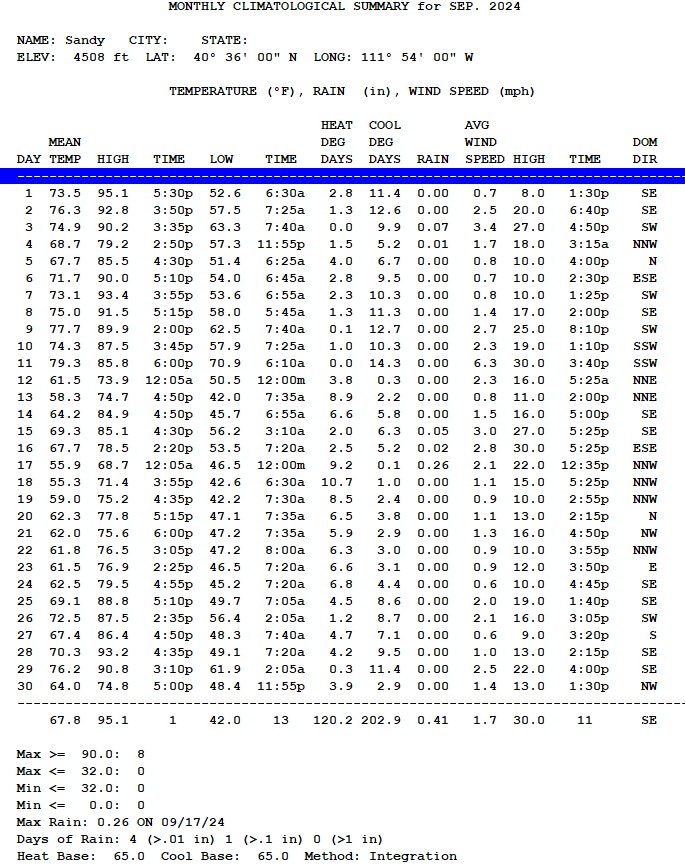
This year's average temperature of 67.8 F (19.9 C) was considerably warmer than the 27-year average of 64.3 F (17.9 C). We reach the danger zone for global warming at 2.5 C. The highest temperature was 95.1 F (35.1 C) on September 1st, and the coldest was 42.0 F (5.6 C) on September 13.
The rainfall was scarce, as only 0.41" (1.0 cm) fell compared to the 27-year average of 1.15" ( cm). Five days of measurable precipitation were observed.
The day before the largest storm, which dropped 0.26" (2.9 cm) of precipitation, the peak wind speed was 30 mph.
August 2024 Climatological Summary
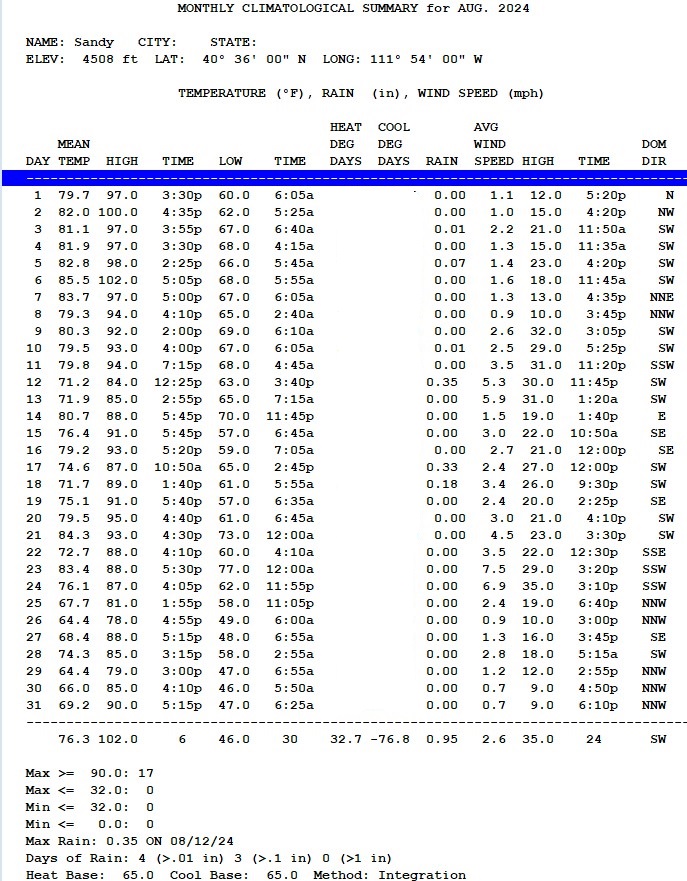
Early in the month, the summer heat continued, with two days with highs over 100 F (32 C). A very early cool spell started on August 12. It's funny that I remember a similar cool spell that began on the same day in the late 1970s. This early summer cooling lasted through August 18th, accompanied by 0.76" ( cm) rain.
The average temperature for August was 76.3 F ( C). Even with the mid-month cool spell, that value is more than four degrees above the 27-year average. The power of global warming is impressive.
Rainfall totaled 0.95" ( cm), close to the 27-year average of 0.97".
July 2024 Climatological Summary
This year, July had 5 days with high temperatures over 100 F (37.8 C), which is 14% of all 100+ July days in the last twenty-seven years. An even distribution of 100-degree days would show 1.5 days per year. It seems like temperatures are getting warmer. The mean temperature for July 2024 was 79.5 F (26.4 C) versus the 27-year average of 77.1 F (25.0 C). The maximum temperature was 103.2 F (39.6 C) on July 11. One hundred-degree days are much less common in both August and September, but August has already recorded its first (August 2).
July was dry but not nearly as dry as June. The total for July was 0.16" (0.4 cm), and the total for the two summer months was 0.17" ( 0.4 cm). The lack of rainfall may correlate with greater water use; however, water conservancy is growing in Utah.
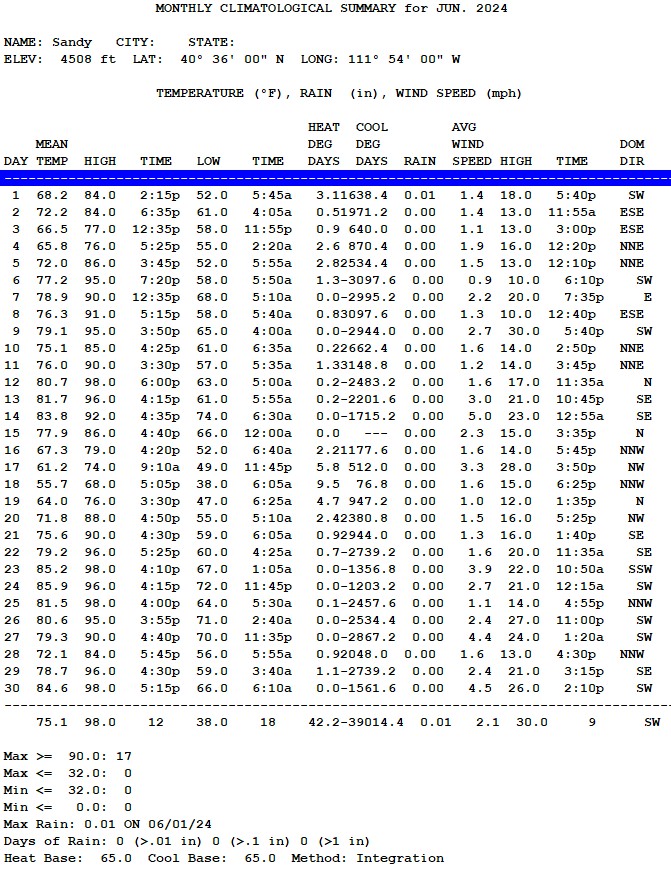
June 2024 Climatological Summary
The earth was parched during June 2024, and there was only 0.01" (0.03 cm) of rain that fell. That rain fell on June 1st. So, is this unusual? No, it is not. In the years 2012 and 2013 both had no rain at all! The day that Tropical Storm Alberto's remnants came by wasn't quite a trace. How do you measure a trace? If you have a sidewalk nearby, see if you can find a few squares that are covered with raindrops. If so, and the rain gauge registers less than 0.01", then you have a trace of rain to report. The 27-year average for precipitation is 0.98" (2.5 cm).
The hottest day of the month was June 12th, when the temperature was 98.4 F (36.9 C). Almost half of the days in June, fourteen to be exact had temperatures that exceeded 90 F (32.2 C).The coldest temperature this year was 38.3 F (3.5 C) on June 18. The coldest June temperature in 27 years was 33 F (0.5 C) in June 2002.
The twenty-seven-year mean June temperature is 68.2 F (20.1 C). June 2024 had a mean temperature of 75.2 (24 C). Does anyone want to debate with me the veracity of global warming?
May 2024 Climatological Summary
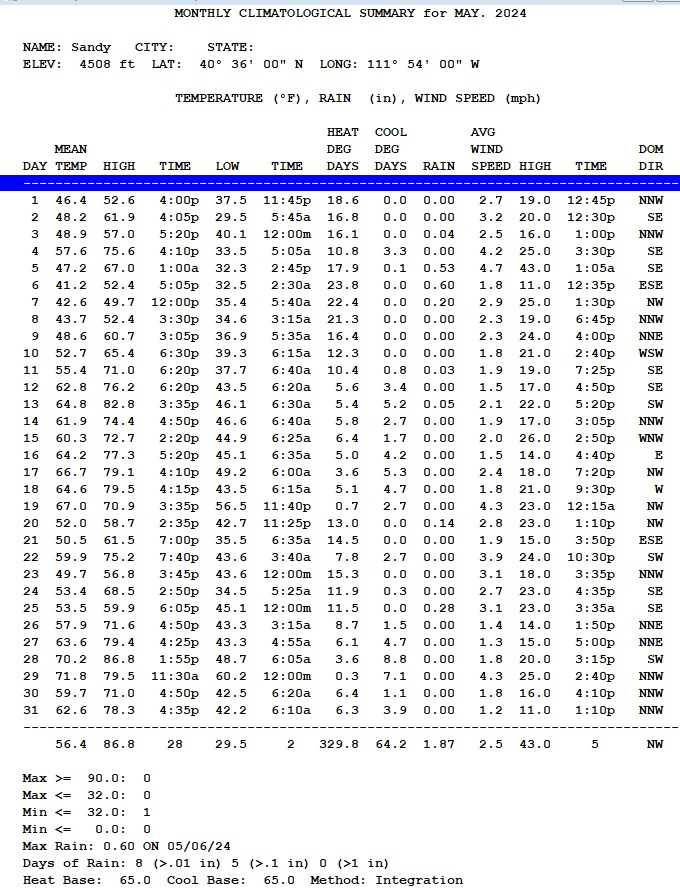
Shiver me timbers, May 2024 was COLD! The month significantly delayed the start of summer. The twenty-seven-year average is 59.6 F (15.3 C), but this May was just 56.4 F (13.6 C), three full degrees below average (Fahrenheit). Please don't act like Donald Trump and say, "See, it's cooler than normal. Climate Change is fake." Wrong! Temperatures for a given day or month are sometimes colder or warmer than average. What you have to look at is the trend, and the trend is unmistakably hotter.
The total precipitation was 1.87" (4.7 cm), which is very close to the twenty-seven-year average of 1.83" (4.6 cm). The rainy period was May 3-7, though almost a third of an inch fell on May 25.
June's first week (and occasionally the second week) is typically rainy. Snow fell in the Salt Lake Valley during the first week of June 1968. It was incredible then and would be MORE incredible now.
April 2024 Climatological Summary
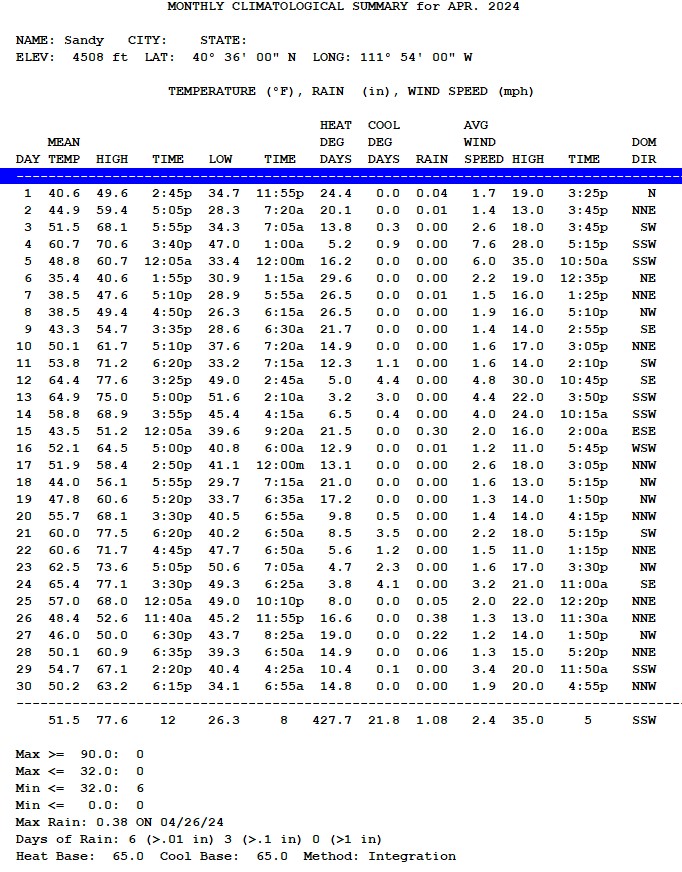
The month was rather dry. If it weren't for the rain that fell April 25-28, it would have been bone dry. Just over an inch (1.08") (2.7 cm) fell. April is often the wettest month of the year. April 2020 was the driest April in the last 27 years, with 0.33" (0.8 cm).
The average temperature for April 2024 was 51.5 F (10.8 C). This compares to the twenty-seven-year mean of 48.7 F (9.3 C), exceeding the twenty-seven-year mean by 2.8 F (1.5 C).
As normal, the prevailing wind direction was from the south-southwest.
March 2024 Climatological Summary
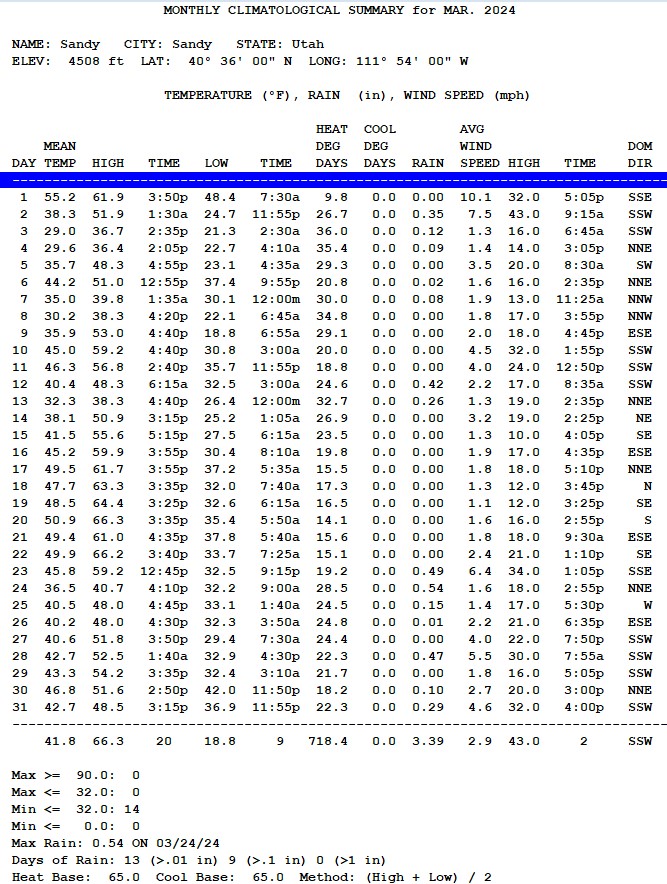
The Spring Months (March, April and May) make up the wettest season in northern Utah. March was very wet, with some snow and lots of rain. March 2024 was much like April used to be. Fifty years ago snow in April melted quickly. Now snow in March melts quickly. Back in High School, I remember that snow storms of over 12" (30.48 cm) were not rare in March. I started to "feel" climate change as early as the 1990s, in the sense that the data was changing.
The total precipitation in March 2024 was well above normal at 3.39" (8.6 cm). The 27-year average is 2.04" (5.2 cm).
The average temperature was 41.0 F (5.0 C) versus a 27-year average of 45.4 F (7.4 C). The frequent storminess kept the temperatures lower than what would have happened with the average storminess.
February 2024 Climatological Summary

In the old days in the Salt Lake Valley, all of the precipitation in February would be delivered as snow. This year thanks to Global Warming most of the precipitation in the valley was delivered as rain. There was a lot of rain and some snow totaling 2.94" (7.5 cm), far above the 27-year average of 1.63" (4.1 cm) yet far below the all-time record of 5.12" (13.0 cm) recorded in 1998. Indeed February 1998 is the wettest of all time at my location.
The number of days where the temperature fell below 32 F ( 0 C) was 23 which is also the 27-year average for the month. The high temperature for the month was 61.1 F (16.2 C) on the 25th. The lowest temperature was 17.5 F (-8.1 C) which occurred strangely on the 28th.
So far the winter season has produced a goodly amount of mountain snow, yet the wettest period for precipitation are the spring months of March, April, and May which produce an average of 6.31" (16.0 cm) of the full-year average of 18.99" (48.2 cm) or one-third of the precipitation for the year.
January 2024 Climatological Summary
While we had some snow in the Salt Lake Valley during January 2024, the total precipitation was just 1.57" (4.0 cm), about an inch below the 27-year average of 2.64" (6.7 cm). A large storm was expected the weekend of January 13-14. This storm hit the mountains but left very little in the Salt Lake Valley.
The twenty-seven-year mean temperature for January is 30.6 F (-0.7 C). The mean for January 2024 was 33.4 F (0.7 C) or 2.8 F (1.4 C) higher than the mean. Global Warming is showing up in data across the world regularly. That said, even without data my attention to the weather confirmed it to me in the 1990s.
Our mountains are on track for a normal amount of snowfall. So long as February, March, and April check in with near-normal precipitation, we should have a normal runoff to fill reservoirs.
My home is in a quiet location concerning the wind. We seldom have wind speeds over 35 mph.