Calendar Year 2020 Climatological Summary
Temperature

Precipitation

Wind

Temperatures ranged from 101.9F on July 21 to 6.4F on February 2. Precipitation was extremely low at 10.06" with June having the highest mount with 2.41". As usual there is not much to say about the wind, as maximum was just 38 mph and the predominate direction was from the southhwest.
December 2020 Climatological Summary

The draught continues. The second half of December featured lots of storms coming though the valley but leaving very little snow as they passed. The west side of the Salt Lake valley had more snow than the east side, a very rare and weird thing for a full month. My rain bucket logged just 0.38" (1.0 cm) (from perhaps 5" (12.7 cm) of snow. The snow melted rather quickly (global warming at hand). For the full year the precipitation totaled 10.06" (25.5 cm) the lowest in all 27 years of records at this site. The average annual precipitation over those 27 years is 18.70" (47.5 cm). The wettest month was June (unusual) with 2.41" (6.1 cm) (while January through March were just small amounts below normal. July through December have been extremely dry.
So far air pollution has been minimal this winter season (again thanks to global warming). This trend is sure to continue. I wish harsh advocates for more pollution control would sit back and enjoy the situation. Over the last 15 years much has been accomplished locally with respect to pollution control.
The average temperature for the month was 29.0 F (-1.7 C) which is just below the 23-year average at this site, as there were 4 more days than normal (all days except for December 21 ) with temperatures below freezing 32F (0 C).
The summer was hot (except June) with 54 days of highs over 90 F ( 32.2 C) and four days over 100 F (37.8 C).
November 2020 Climatological Summary

The severe part of the current draught is now 5 months along and I’m not hearing many people talk about it. Since mid-June precipitation in the Salt Lake City area has been sparse, to say the least. November was no exception with just over a half-inch (1.3 cm) of precipitation, most of that fell on November 7 and 8. The total precipitation with one month left in 2020 is just 9.69” (24.6 cm) or about 50% of the annual normal.
Temperatures for November averaged 40.3 F ( 4.6 C). That value is 0.5 F above the 23-year average at this location. The low temperature for November 2020 was 16.7 F ( -8.5 C) on November 27. That’s nowhere near the record low over the past 23 years of 4 F ( -15.5 C) recorded in 2011.
October 2020 Climatological Summary

Sandy Utah Climatological Summary for October 2020. The lack of precipitation since mid-June is starting to get serious. In October there were just two days with precipitation for a total of 0.25" (0.6 cm). Total precipitation for July, August, September, and October is just 0.44" (1.1 cm).
Kevin Eubank (KSL-TV) mentioned this past week that when a high-pressure area sets up off the west coast of the United States in the fall that winter precipitation is generally lower than normal. This is consistent with the La Nina pattern (the pattern is determined by ocean temperatures off northern South America). The U.S. Weather Service is calling for about normal precipitation this winter season for the Utah area. With La Nina in place I think we will be below normal, the question is "How far below normal?" Failure to have normal mountain snowfall this winter will mean water restrictions next summer.
As far as temperatures go the average for this October was 51.9F (11.0 C) which is a full degree above my 23-year average of 50.9F (10.5 C).
My heart goes out to residents of Louisiana which have been hit this year with 3 hurricanes in just 60 days. Such an occurrence is highly uncommon. Louisiana and Mississippi are the two poorest states in the United States. Two of the three were direct hits on Lake Charles (western coastal Louisiana). The increased number of hurricanes can be directly traced to global warming. The individual intensity of a given hurricane cannot be directly tied to this temperature change. For example, there were no Category 5 hurricanes that hit the U.S. this season, but the season does not end for another month (November 30).
September 2020 Climatological Summary

A bit warmer and much drier than normal summarizes September 2020. Total precipitation for the past 4 months has been just 0.89" (2.1 cm) with most of that (0.73" (1.8 cm)) coming in June. You can't blame the lack of precipitation on global warming. Climate science at best simply has "guesses" as to how precipitation patterns will change. We will need a lot of precipitation this winter to catch up on our water storage to where it needs to be. The 23-year average precipitation here is 1.25" (3.2 cm).
The hottest September day in 23 years was September 5th with 99.6 F (37.5 C). The average temperate increased by just 0.1 F., as the last few days of the month were much cooler than the rest of September.
August 2020 Climatological Summary

You can simply summarize it in one word "HOT". A new all-time (23 years) high was set on August 2 at 104.0 F ( 40.0 C). The second word for the month was "DRY". The total precipitation was a trace, just enough to wet the sidewalk completely, but not enough to record anything but 0.00" (0 cm).
The only days where the temperature did not exceed 90 was the last two days of the month. The first true cold front of the season came early on August 31st sending temperatures down 15 F (9.2 C).
August often is influenced by the Western Desert Monsoon, but this August the flow was never positioned right to get the moisture from the south all the way to the Salt Lake City area. Southern Utah had some significant rainfall during the month, including real flooding in the St. George area.. The monsoon often continues into September,however, since Salt Lake City has already experienced a real cold front, the monsoon may never return to the northern part of the state again in 2020.
July 2020 Climatological Summary

Sandy Utah Climatological Summary for July 2020. Dry and Hot describe July in Sandy Utah and this year things were rather normal. The average temperature was 76.5 F (24.7 C) exactly on the 23-year history at this location. There was just one day with the temperature over 100 F (37.7 C) and that was the last day of the month with a high of 101.9 (38.8 C).
There was practically no rain at this location the total for the month was 0.07" (0.2 cm)versus a 23 year average of 1.85" (4.7 cm). Even the Salt Lake City airport recorded 0.23" ( 0.6 cm). The precipitation amount in July is highly dependent on the start of the Western Desert Monsoon which typically starts in mid-July. It was right on schedule this year, however, the rain seldom came up to the Salt Lake City area from the south. Areas south of Salt Lake City received a lot more precipitation.
June 2020 Climatological Summary

June 2020 featured two storms that were incredibly COLD. The first June 7-9 produced a low of 35 F ( 1.6 C) on June 9 along with 1.53" (3.9 cm) of precipitation. Again the first week of June brought some big rains. The second one, on the last days of the month, produced a low of 43.3 F (6.3 C) on June 29, along with 0.25" (0.6 cm) of rain. The full month produced 2.41" (6.1 cm), far ahead of the 23 year average of 1.08" (2.7 cm).
The mean temperature of 66.1 F (18.9 C) was a full degree below the 23-year average. There were only 2 days where the temperature exceeded 90 F (32.2 C). Just because this June had a below-average temperature, does not mean global warming is not happening, it just means that global warming does not override natural variability in the day-to-day and month-to-month weather.
May 2020 Climatological Summary

The spring drought continued through May. A storm on May 22 and 23 brought a half-inch (0.50" / 1.27 cm) of rain and that single storm provided most of the precipitation during the month. May is typically a wet month but not as wet as March and April. This spring was very dry which has brought us to a situation of HIGH FIRE DANGER much earlier in the year than normal. Unless some significant rain in June moderates the danger, there could be a lot of fires this summer. Please be careful when in the mountains or other open areas.
This May was 3 degrees warmer than the 23-year normal reaching 61.2 F (16.2 C). The last three days of the month featured high temperatures above 90 F (32.2 C). The 23-year high for May is 96.4 F (35.8 C), while the highest this year was 95.8 F (35.4 C).
The first week in June is often stormy, but not always. I remember in 1968 that it snowed in Holaday where I grew up during the first week in June. There were riots all across the U.S. at that time, similar to this year. That was the only valley snow in June that I have ever seen.
April 2020 Climatological Summary
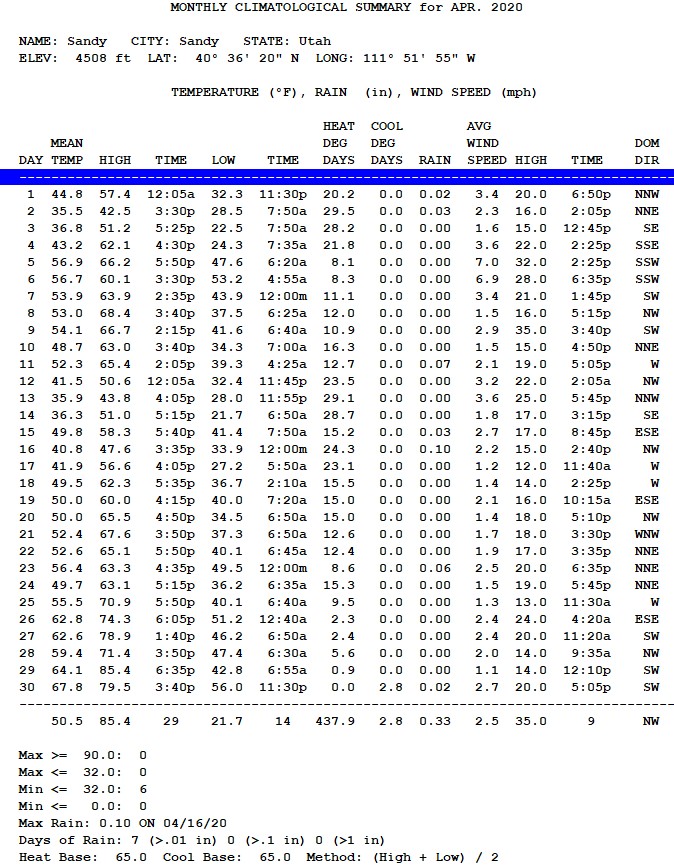
A dry April is not good. We count on April for a good portion of our annual rainfall. Normally it is the wettest month of the year in northern Utah. This dry month is a setback to what was looking like a good year with respect to water. Can a wet May make up for it? Yes, but it would have to be a May which has significantly more rainfall than normal.
My rain gage recorded just 0.33" (0.8 cm) of rain. While a few days were pure sunshine, more days were highly filtered by mid to high-level clouds adding to the gloom of the Covid-19 pandemic.
Just before the month ended the temperature shot up to 85 F (29.4 C) on April 29. Early in the month, there were just 5 days where the temperature fell below 32 F (0 C).
This year April added to our dry conditions whereas normally it puts more moisture in the ground than it takes away.
March 2020 Climatological Summary

March 2020 came in like a LION with 3-4" (7.6 to 10.1 cm) of heavy wet snow. It ended more like a LAMB even though full days of sunshine were hard to find this year.
Precipitation for March totaled 1.73" (4.4 cm). Compared to my 23-year normal it was just a bit below normal. Last year was the wettest March I've ever recorded with precipitation totaling 4.62" (11.7 cm). There were places nearby with more precipitation this month, as some storms danced around Sandy. Normally March and April are the wettest months in the Salt Lake City area and we depend on them for each year's precipitation rising to its normal level.
The highest temperature for March 2020 was 67.7 F (19.8 C). The low was 19.6F (-6.9 C) on March 6. The mean temperature was 44.1F (6.7 C) which was slightly above normal 42.8F (6.0 C).
February 2020 Climatological Summary

While January 2020 was on the warm side February 2020 was on the cold side. Winter was pleasant in January, not so pleasant in February. The mean temperature was 33.6 F (0.9 C), which was actually colder than January 2020 which came in at 34.0 F (1.1 C). Surprisingly the coldest temperature of the winter of 2019-2020 came on February 4th at 6.4 F (-14.2 C). It is rare indeed when the coldest temperature of the winter falls outside the range of December 23 - January 10.
The month also offered plenty of snow with the biggest storm on February 3rd which left nearly 1" (2.5 cm) of water content. The month's total was 1.76" (4.5 cm). The last half of the month was dry, but that dry period ended on the 1st of March when 4" of wet snow came that Sunday morning.
January 2020 Climatological Summary

With a mean temperature of 34 F (1.1 C) this January was quite warm. My 23 year average at this location is 30.3 F (-0.9 C). The high temperature was 52.5 F (11.4 C). That was warm but does not match 62.1 F (16.7 C) in 2003. The mean temperature that year was 28.6 F (-1.9 C).
Precipitation was a bit light at 1.87" (4.7 cm). Through most of the month, the upper airflow was "zonal" meaning west to east. That pattern brings warmer than normal air and frequent storms that moved through very fast. Good for the mountains, not as much precipitation in the valley.