Calendar Year 2022 Climatological Summary
Temperature

Precipitation

Wind

Temperatures ranged from 102.7F on September 6 to 5.6F on January 2. Precipitation was quite low at 13.94" with December having the highest amount with 3.26". As usual there is not much to say about the wind, as maximum was just 42 mph and the predominate direction was from the southhwest.
December 2022 Climatological Summary
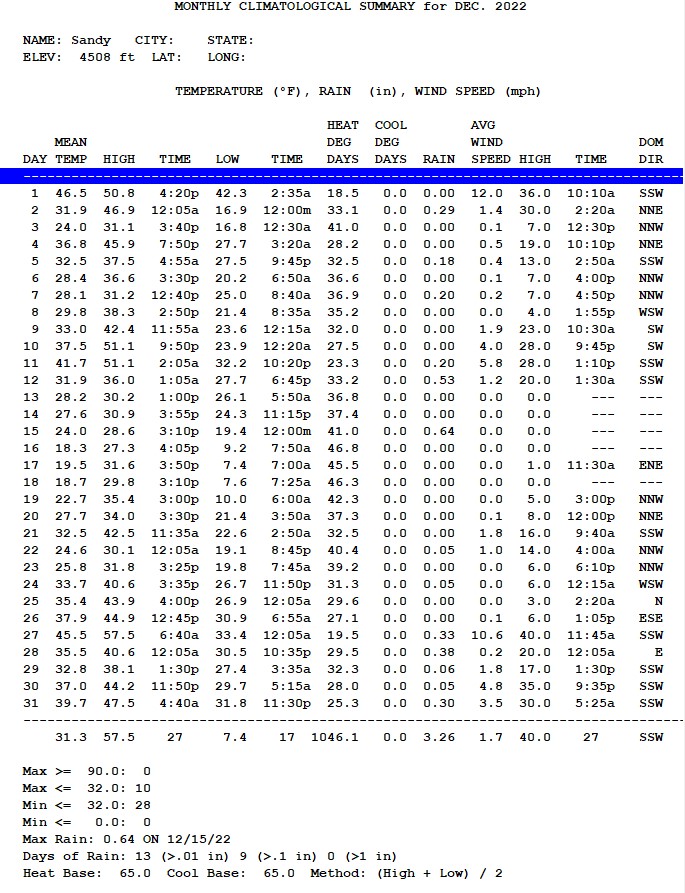
The first half of December was cold, but the second half was much warmer than normal. The coldest temperatures in the Salt Lake area usually occur between December 24 and January 10, that won't be true this year as a warmer zonal flow has dominated the weather pattern since mid-December. The average temperature this year was 31.3 F (0.6 C) above the 25-year average of 29.6 F (-1.3 C).
Last year December was wet at 3.24" (8.2 cm), this year was almost identical at 3.26" (8.3 cm). Each of the last 5 days of the month had some precipitation totaling over an inch of water content.
The annual total precipitation for 2022 was 13.94" (35.4 cm), well below the 25-year average of 17.97" (45.6 cm)
November 2022 Climatological Summary

Precipitation for the month was above average, and two storms put snow on the ground to the valley floor. The total was 1.86 inches (4.7 cm) which beats the 25-year November average of 1.33 inches (3.4 cm). Local ski resorts opened on time (around Thanksgiving) for the first time in several years.
However, the El Niño/La Niña Southern Oscillation is still in La Nina mode, suggesting that precipitation in the Western United States south of the 42 parallel will remain below average.
The total precipitation so far for 2022 is now over ten inches, or about 60% of the long-term normal.
October 2022 Climatological Summary

The temperature reached 89.1 F ( 31.7 C) in 2010. This year the maximum temperature was 79.2 F (26.2 C) on October 9. The coldest day in the past 25 years was an amazing 8 F (-13.3 C) in 2019.
The average temperature this year was 51.5 F ( C). This compares to an average of 50.7 F (10.8 C), putting this year just a bit warmer than normal, but nothing like how the last few months exceeded the normal.
Historically, I'd mow the lawn for the last time the first week in October, now I mow it for the last time around Halloween. While the time of the first cutting in the spring has not changed much, the last cutting has changed by a significant amount, due to global warming.
September 2022 Climatological Summary

As usual, the American West Desert Monsoon was in northern Utah, but the locations and amounts of rain varied greatly from place to place. For example, one day, Alta, up Little Cottonwood Canyon, had well over an inch of rain while most of Salt Lake County was dry. My total for the month was 0.47" (1.2 cm). Last September was the wettest ever with heavy rain from the monsoon. Last year, the total was 3.14" (8.0 cm), beginning recharging of groundwater which was augmented with even more in October 2021.
At my location, there were 3 days with temperatures above 100 F ( 37.8 C), the first 100+ days in September ever recorded here. The Salt Lake Airport had seven such days. It was "4th of July hot" in early September in the Salt Lake City area. The mean temperature was 69.2 F (20.7 C), 5.8 F (3.2 C) above the 25-year normal (that difference, by the way, is enormous). If we have another dry winter, the lack of water will be significant and challenging.

August 2022 Climatological Summary

While there was not a single day with a temperature over 100 F (37.7 C), there were 19 over 90 F (32.2 C). The 25-year average of days over 90F is 13. The last days of the month were exceptionally HOT! The final 10 days of the month were all over 88 F (31.1 C).
The total precipitation for August was 1.36" (3.5 cm). That's well above the 25-year average of 0.92" (2.3 cm). The American West Desert Monsoon was active, but not as active as a year ago when the total was 4.34" (11.0 cm) with 2.03" (5.2 cm) in a single day on August 18, 2021. It was that heavy rain, followed by moderate rain the rest of the year that raised the total for 2021 to just a bit above normal.
July 2022 Climatological Summary

J uly 2022 was hot as (add your own word). The official National Weather Service station at Salt Lake International airport had 19 days of 100 or higher. In Sandy at my station, there were just two. So why is there such a difference? The airport is 300' feet lower. That accounts for 1/2 degree. The rest is due to the increasing urbanization around the airport and the fact that my weather instruments are on the roof and not near the ground.
The mean temperature was 81.5 F ( 27.5 C) which exceeds the 25-year average of 76.9 F (24.9 C) by almost 5 degrees Fahrenheit! That's an extreme anomaly even with Global Warming starting to get the attention of many people.
Precipitation was also BELOW average. The total was 0.26" (0.66 cm). There have been a few Julys in the past 25 years where there was no precipitation at all.
The American West Desert Monsoon (AWDM) my name, did not reach the Salt Lake City area before July ended, but it had reached Southern Utah where flash floods were seen in several locations.
June 2022 Climatological Summary

Total precipitation for June was 0.70" (1.8 cm) which is less than the 25-year average of 1.06" (2.7 cm). Precipitation for the first six months totaled only 5.76" (14.6 cm) as the western drought below the 42 parallel continues.
I believe the main influence on this draught is the El Nino Southern Oscillation (ENSO) is in La Nina mode. When it switches back to El Nino mode, precipitation will strengthen in the drought area. I know it seems totally weird that ocean temperatures off the coast of Ecuador have such an influence, but this has been proven to be the case. There are some other oscillations around the globe, but none of them have shown to be as powerful as ENSO.
Further, as the American West Desert Monsoon (my name) begins later this month, I expect some heavy thunderstorms, even exceeding what we saw last summer to provide some mitigation of the drought.
As for temperatures the mean was 70.8 F (21.5 C), almost three degrees over the 25-year average of 68.0 (20.0 C), quickly flipping from colder in May to warmer in June.
Earth Networks a professional Meteorological consulting firm put out their 2022 forecast.
- Named Storms 18 (tropical storm strength or greater)
- Hurricanes 8 (Category 1-3 -- Safir Simpson Scale)
- Major Hurricanes 4 (Category 4-5)
These numbers represent a BUSY hurricane season. They attributed much of the forecast to ENSO being in the 'La Nina' configuration.
They also predicted more storms developing in the Gulf of Mexico than normal.
The first hurricane of the season 'Agatha' developed in the Pacific Ocean and crossed Central America into the Gulf of Mexico prior to the official start of the season. Most storms born in the Eastern Pacific off the coast of Mexico simply move further west out into the Pacific. Some of them do visit Hawaii.
You can relax for now. Generally, these storms are not noteworthy before mid-August. Then again this is predicted to be an abnormally busy hurricane season.
May 2022 Climatological Summary
 <
<
On the precipitation side, the total hit 2.02" (5.1 cm) which is slightly above the 25-year average of 1.88" (4.8 cm). The wettest day was May 30. This storm did not reach south of Provo, as the storm was a rare one to drop below the Utah-Idaho border. While not a draught buster the month did exceed the normal for the month.
It is ENSO (El Nino Southern Oscillation) that is causing our current drought. We are in an extended La Nina period which has focused a persistent ridge over California and generally prevented most storms from dropping below the Utah/Idaho border. The outlook for ENSO is a continued La Nina through the end of 2022. It will require changing to El Nino to break this drought.
April 2022 Climatological Summary

The rain gauge continued to collect far less water than is normal for April. The total for April was 1.23" (3.1 cm), far lower than the 25-year average of 2.55" ( 6.5 cm). April 2020 was the direst of the past 25 years with just 0.33" (0.8 cm), while 2021 was also dry at 0.61" (1.5 cm). The last wet April was 2019 with 3.99" (10.1 cm). Strong storms that looked like they would hold together, but fell apart before reaching Utah.
The average temperature for the month was 47.9F (8.3 C), just BELOW the 25-year average of 48.5F (9.1 C). The highest April temperature in the past 25 years was 86.7 F ( 30.4 C) in 2012.
I keep hearing people say the current draught is due to climate change. While generally higher temperatures do translate to greater evaporation, I don't have any faith at all in climate models that describe the distribution of future precipitation.
With respect to climate change, you have to focus solely on what is caused by higher temperatures. The warmer the air, the more moisture it can carry, more moisture in the air translates directly to storms with more precipitation.
I've read that people say that runoff this spring will be impacted by dry soils last fall. Not sure how we had dry soils when last fall provided abundant precipitation in northern Utah.
March 2022 Climatological Summary

March 22 was decidedly on the dry side. Other locations in the Salt Lake valley did receive more than the 0.99" (2.5 cm) of precipitation than my home. The 25-year average for March is 4.62" (11.7 cm). Seven days in March had some precipitation, with 0.23" ( cm) on March 20, being the most in any one day. The Salt Lake area is still in some draught. The average for April is 5.03" (0.58 cm) and May is 5.79" (14.7 cm). If we come even close to those amounts we should be able to get by this summer, otherwise, the water supply will be tight.
The mean temperature was just a bit above the 25-year average at 43.7F (6.5 C) (the average is 42.8F (6.0 C)). The lowest temperature was 12.2F (-11.0 C) on March 11. The lowest March temperature here was 10.4F (-12 C) in 2007. The highest temperature was 78.4F (25.8 C) on March 26, just 0.1F below the highest ever recorded in March 2002.
February 2022 Climatological Summary

The sequence of alternating wet and dry months ended as February 2022 brought in only 0.33" (0.8 cm) of rainfall. The official station at Salt Lake International Airport totaled a few hundredths less. This February was the lowest precipitation recorded in February in the 25-year history of my station. The 25-year average for February is 1.58" (4.0 cm).
The last week of the month (Monday 21 - Friday 25) was like being in the "Garden of Eden." [See Genesis 2:6]. Every morning the snow fell from the sky and wet the dry ground. Lake effect storms coming off the Great Salt Lake were the main contributor.
The average temperature for February 2022 was a bone-chilling 30.9 F (-0.6 C). That is 2.5 F below the 25-year average. The un-educated would see this remarkable departure from normal and claim there is no Global Warming. Global warming can only be seen in the long-term trend lines and not in the data for any one day, one month, or one year. There were two very cold mornings February 3rd at 7.1F (-13.8 C) and February 26th at 8.6F (-13.0 C). Neither of these broke the record low for the winter season of 5.6 F (-14.6 C) on January 2.
January 2022 Climatological Summary

Last January (2021) was the dryest with 0.36" ( cm) in 25 years of data. This January (2022) was just a bit wetter. The only really stormy day was January 5th. There were a few other days with minor snowfall of less than 1/2" (1.27 cm).
Temperatures were a bit colder than normal. The average for the month was 29.4 F (-1.4 C) versus a 25-year average of 30.4 F (-0.9 C). Only two days during the month failed to drop below freezing. Those dates were January 6-7. The coldest morning was January 2, just after the year-end snowstorm cleared out. The low that day was 5.6 F (-14.7 C). That will most likely be the coldest temperature of this winter season. Frequently the coldest temperature of the year occurs between December 25 and January 10. So nothing unusual about the very cold morning on January 2nd.